| Stocks | Markets | Idea Generator | | Help/Email | | ETF Center | | Stock Watch | | Screening Tools | | Trading Ideas | | Advanced Tools |
|
|
RSI - Relative Strength Index
The Relative Strength Index (RSI) was developed by J. Welles Wilder to detect Overbought and Oversold conditions. The name Relative Strength Index is slightly misleading as the RSI does not compare the relative strength of two securities, but rather the internal strength of a single security.
The RSI is comprised of three variables: 1) the average of all up closing prices during a given period; 2) the average of all down closing prices during the same period; and 3) the length of the period in days over which these averages are taken. RSI measures the degree of strength left in a price trend. If price has been declining and RSI drops to 30 or lower, traders should be alerted to a probable reversal of the downtrend, since momentum would appear to be losing its strength. If RSI moves above 70 as price rises, an intermediate top is usually imminent. The time period used by most traders is nine days.
RSI can be a valuable indicator when timing entry and exit points as well as a good trading tool. When approaching the market from the Buy side, open positions when the stock's RSI approaches 30. Conversely, when initiating a short sale, wait until the RSI approaches 70.
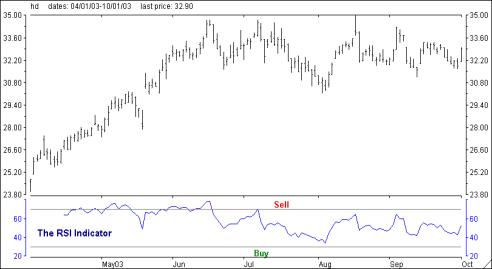
The chart of Home Depot (HD) located below is a good example of price action to be expected when the RSI approaches 70 (Sell) and 30 (Buy). Note the price decline that occurred in early May and mid-June as RSI moved over 70. Conversely, HD recorded a significant bottom in early August as RSI approached 30. RSI also provides a trader with an edge as to when to take a short-term profit, wait for a pullback and then reopen the position.
 The Relative Strength Index should not be confused with 50-Day Relative Strength or with Relative Strength Value (RSV). 50-Day Relative Strength is a comparison of a stocks performance over the previous 50 days with that of the S&P 500 while RSV is a measurement of a stock's performance versus a universe of stocks. Market Edge computes RSI, the 50-Day R-S and RSV for over 4400 stocks on a daily basis. They are included in the Second Opinion report and the various screening modules.
|
The risk of loss on a short sale is potentially unlimited since there is no limit to the price increase of a security. There is no guarantee the brokerage firm can continue to maintain a short position for an unlimited time period. Your position may be closed out by the firm without regard to your profit or loss. Short sales may only be submitted in a margin-approved account. Margin is not available in all account types. Carefully review the TD Ameritrade Margin Handbook and Margin Disclosure Document before applying for margin. Please see the TD Ameritrade Web site or contact TD Ameritrade for copies of these documents.
Past performance is not a guarantee of future results. The data contained in Market Edge is obtained from sources considered by Computrade Systems, Inc. to be reliable but the accuracy and completeness thereof are not guaranteed. Computrade Systems, Inc. does not and will not warrant the performance and results that may be obtained while using the Market Edge research service.
The Market Edge research service & Second Opinion are neither offers to sell nor
solicitations of offers to buy any security.
Company profile, estimates and financials provided by
S&P Capital IQ.
See User
Agreement for other disclaimers.
Market Edge and Second Opinion are registered trademarks of Computrade Systems, Inc.
© 2016 Computrade Systems, Inc.
© 2016 The McGraw-Hill Companies, Inc. S&P Capital IQ is a division of The McGraw-Hill Companies, Inc. See full Copyright for details.